The carbon footprint of milk

This section contains two parts, one video and one article, both below.
Part 1: Video
Part 2: Article
The carbon footprint of milk over time
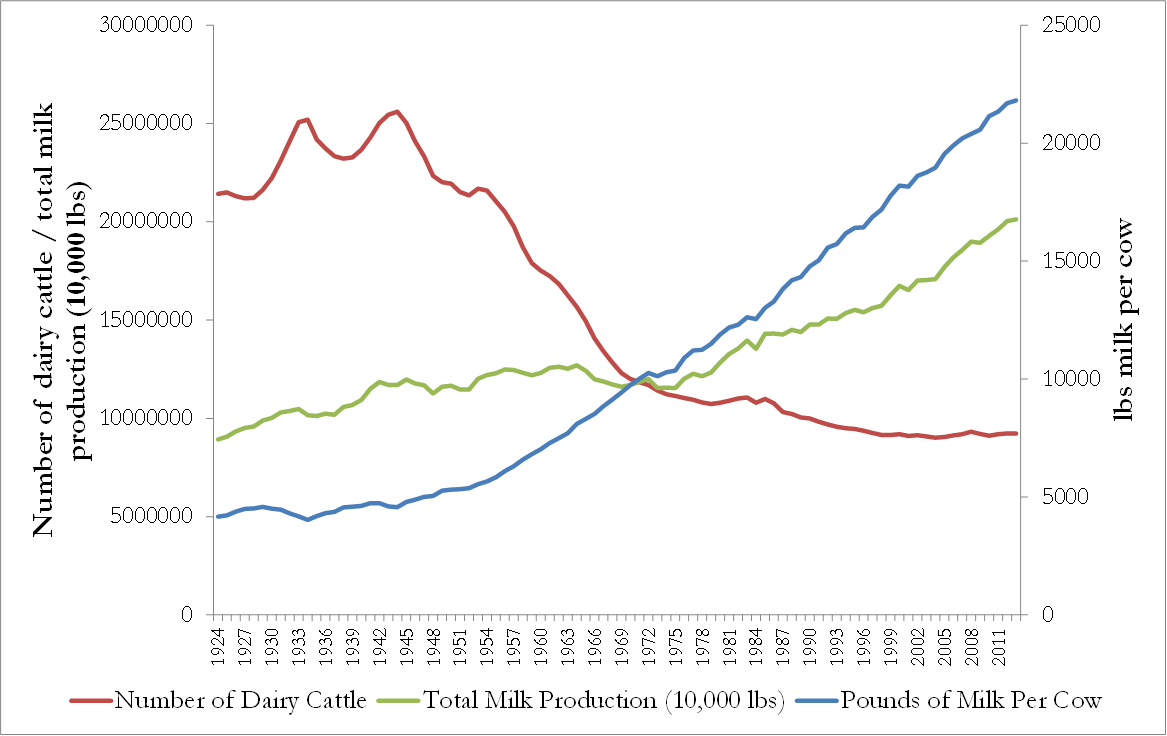
Artificial insemination allows bulls with superior genetics to have far more offspring than would be possible using natural breeding. These superior genetics have led to an astonishing rise in cow productivity in the last century. While the number of dairy cows in the U.S. has fallen from around 17 million to 9 million since 1960, total milk production has risen 40%. How? Because each cow is producing more milk.
A lot more! In 1960 the average cow produced about 755 gallons (or 6,493 lbs) of milk per year, while today she will produce over 2,326 gallons (or 20,000 lbs). Each dairy cow today produces about 200% more milk compared to one in 1960!(G1,N1)
Figure 1—U.S. dairy production over time (all units on a per annual basis)
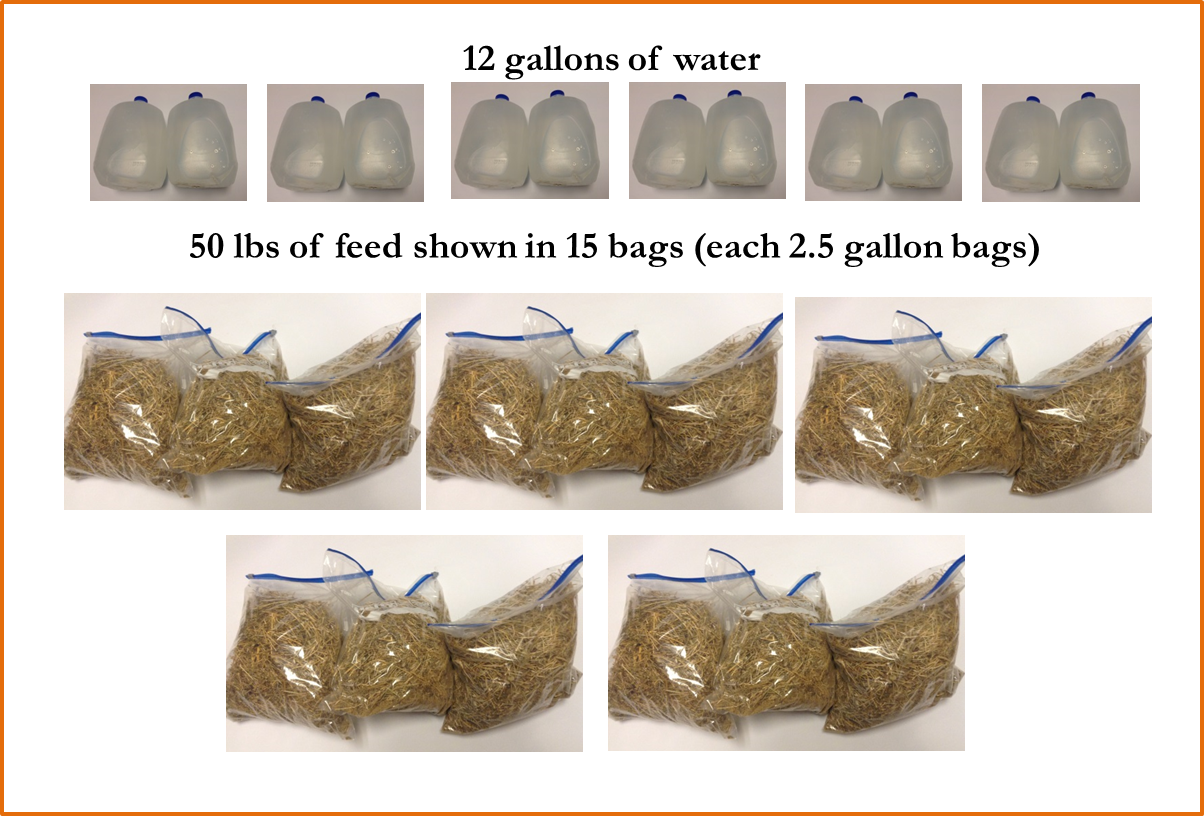
One of the best illustrations of this leap in productivity can be seen in the resources needed to produce a gallon of milk. In 1945 it took about 12 gallons of water and 50 lbs of feed to produce one gallon of milk (note: water only includes what the cow drinks, not the water necessary to raise crops for cattle feed, nor does it include water drunk in her youth), while today ...
Figure 2—What the cow needs to make one gallon of milk in 1945
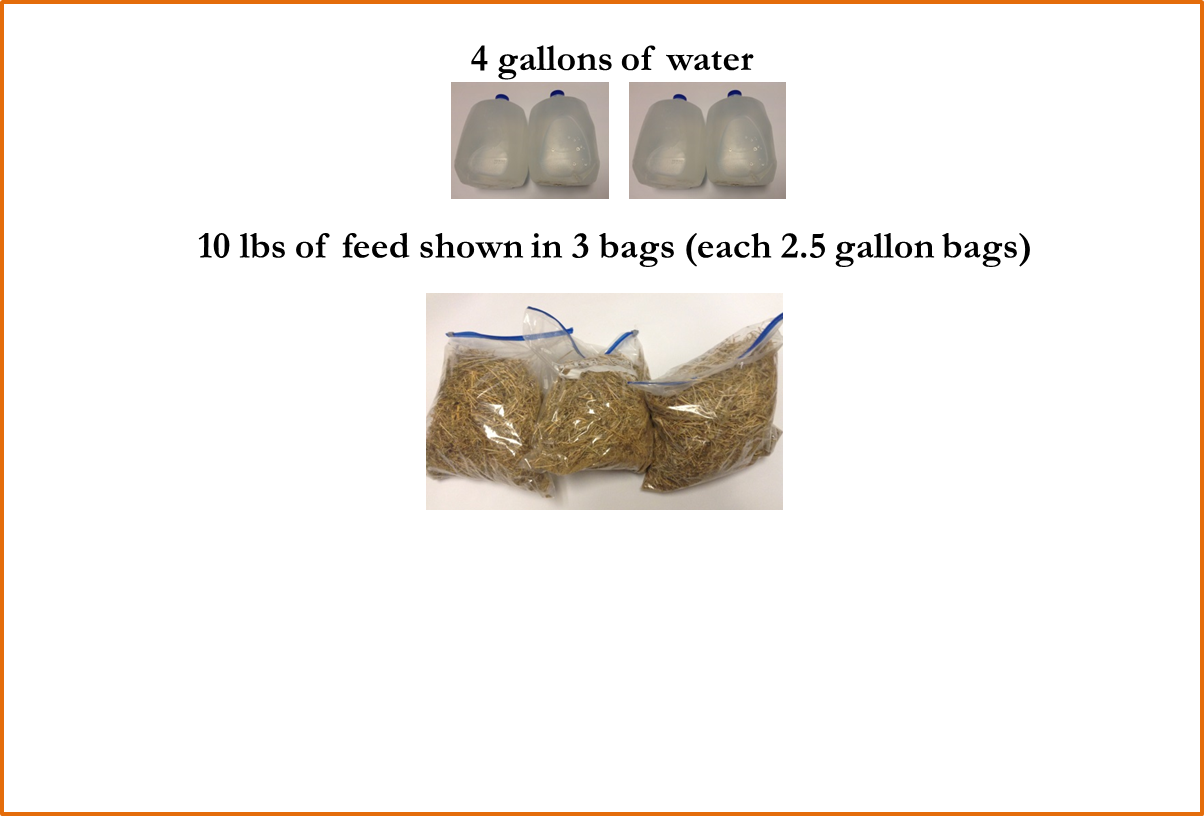
... it takes only 4 gallons of water and 10 lbs of feed to produce that same gallon of milk.(C1,D2,F3) (On the OSU dairy farm this feed consists of Alfalfa hay, Bermudagrass hay, cotton seeds, grains, and various vitamins and minerals.) For each gallon of milk you drink today, the farm requires only 20% of the feed and around 33% of the water than a gallon in 1945.
Figure 3—What the cow needs to make one gallon of milk today
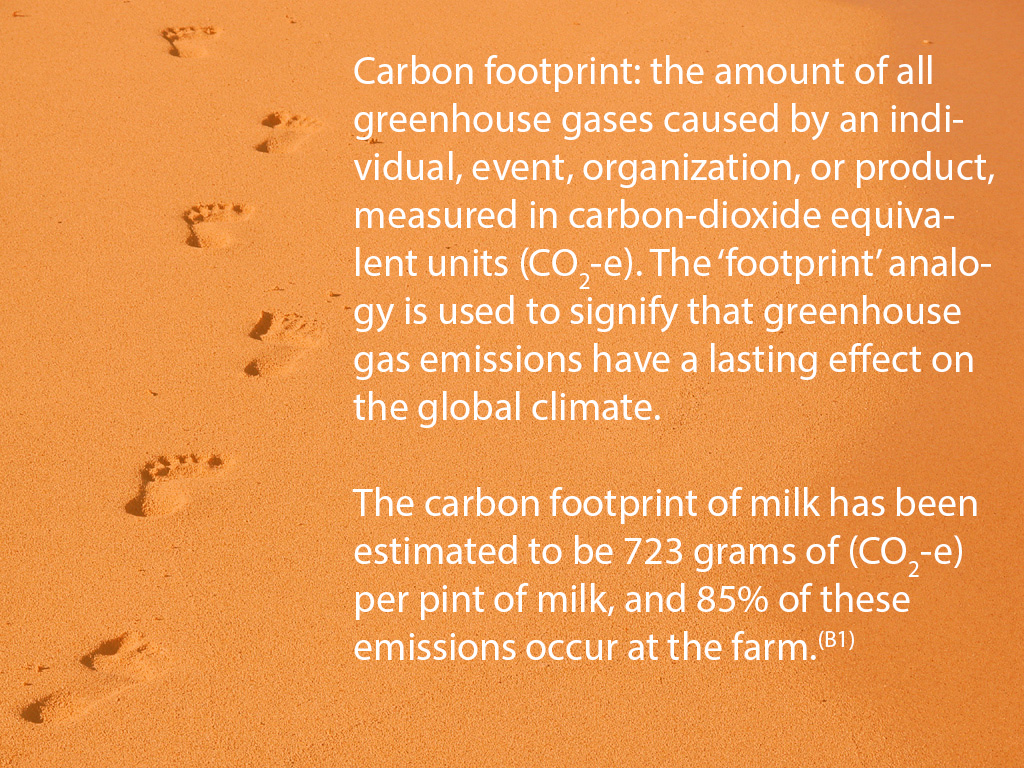
By using less resources for each gallon of milk, the price of milk falls, but so does its carbon footprint. If fewer inputs are needed to produce one gallon of milk, that corresponds to fewer carbon emissions. In fact, the carbon footprint of a gallon of milk in 1945 was almost three times greater than the footprint today!(C1) (Note that “carbon” refers to carbon-equivalent emissions. For instance, methane is a greenhouse gas that creates 21 times the warming of the same amount of carbon, but instead of saying “one ton of methane” I say “21 tons of carbon”.)
Figure 4—What is a carbon footprint?
This does not imply that the total carbon emissions from dairy production has fallen, as more milk is produced in the U.S. than in 1945. To measure how total carbon emissions have changed, let X be the total carbon emissions from dairy production in 1945. If the same amount of milk were produced today, the new level of emissions would be (1/3)X. However, milk production has risen 68% since 1945, and so the new level of carbon emissions from all the milk produced in the U.S. is (1.68)(1/3)X = 0.56X. Consequently, a rough calculation suggests dairy production today leads to about half the total carbon emissions compared to dairy production in 1945, despite producing much more milk.
Cows are producers of methane, a greenhouse gas, and they expel methane as they burp, which can be as often as once a minute. So being able to get more milk out of a single cow is like getting more milk for each lb of methane emitted, allowing us to consume foods we enjoy while benefiting the environment at the same time.
(Of course, you might feel that despite the lower carbon footprint total emissions from dairy production are too high, but we postpone that consideration to another lecture.)
Of this surge in productivity throughout the last fifty years, 2/3 is due to better genetics, and 1/3 is due to better management and feed.(D1)
This attention paid to genetics is a rather recent part of running a dairy farm, when viewed from the long timeline of agriculture.
Selective breeding in dairy cattle
Up until around the time of Henry VIII of England (you know, the guy who lopped off two of his wives' heads), little care was given as to what cows would be bred with another. When King Henry broke with the Catholic Church he felt it prudent to go ahead and confiscate the monastery lands and sell them to a few of his favorites. This gave big landowners the monetary incentive to increase productivity through better breeding, an incentive that wasn’t very strong for monasteries. At the time, cattle were better described as different ethnicities in each region as opposed to different breeds. Each region had its own particular genetics, and people were not eager to import the genetics of other regions.(F1) Once more thought was given to the question of which animals to breed, it became apparent that it mattered little where a bull was from so long as its offspring produced lots of milk. Following this logic, milk production rose considerably and began an institution of genetic improvements that led to distinct breeds of cattle.
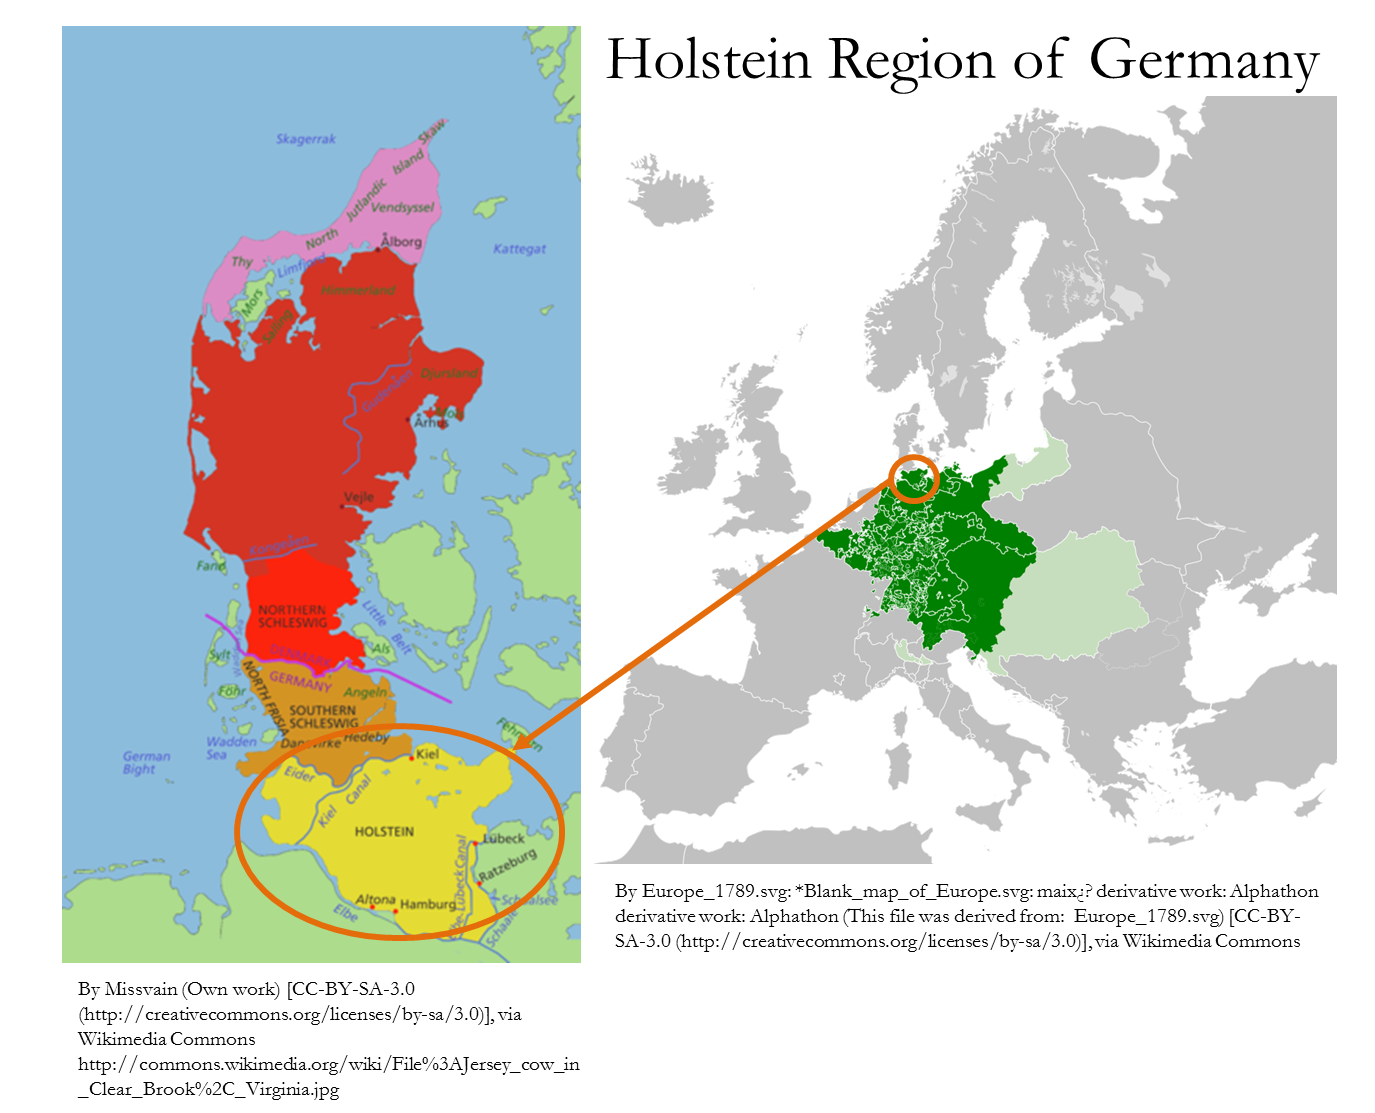
The black and white cow you see below—and in every Chick-fil-A commercial—is referred to as a Holstein in the U.S. and a Friesian elsewhere. Every now and then a recessive gene will cause them to be red and white. They are called Holsteins or Friesians because this line of cattle was developed in both the Friesland of the Netherlands and the Holstein region of Germany. These cattle were imported to the U.S. at different periods, but most of today’s U.S. Holstein cattle can trace their ancestors back to the imports arriving between 1877 and 1905,(D1) and are the most popular dairy breed because of their superior milk production.
Figure 5—Holstein breed
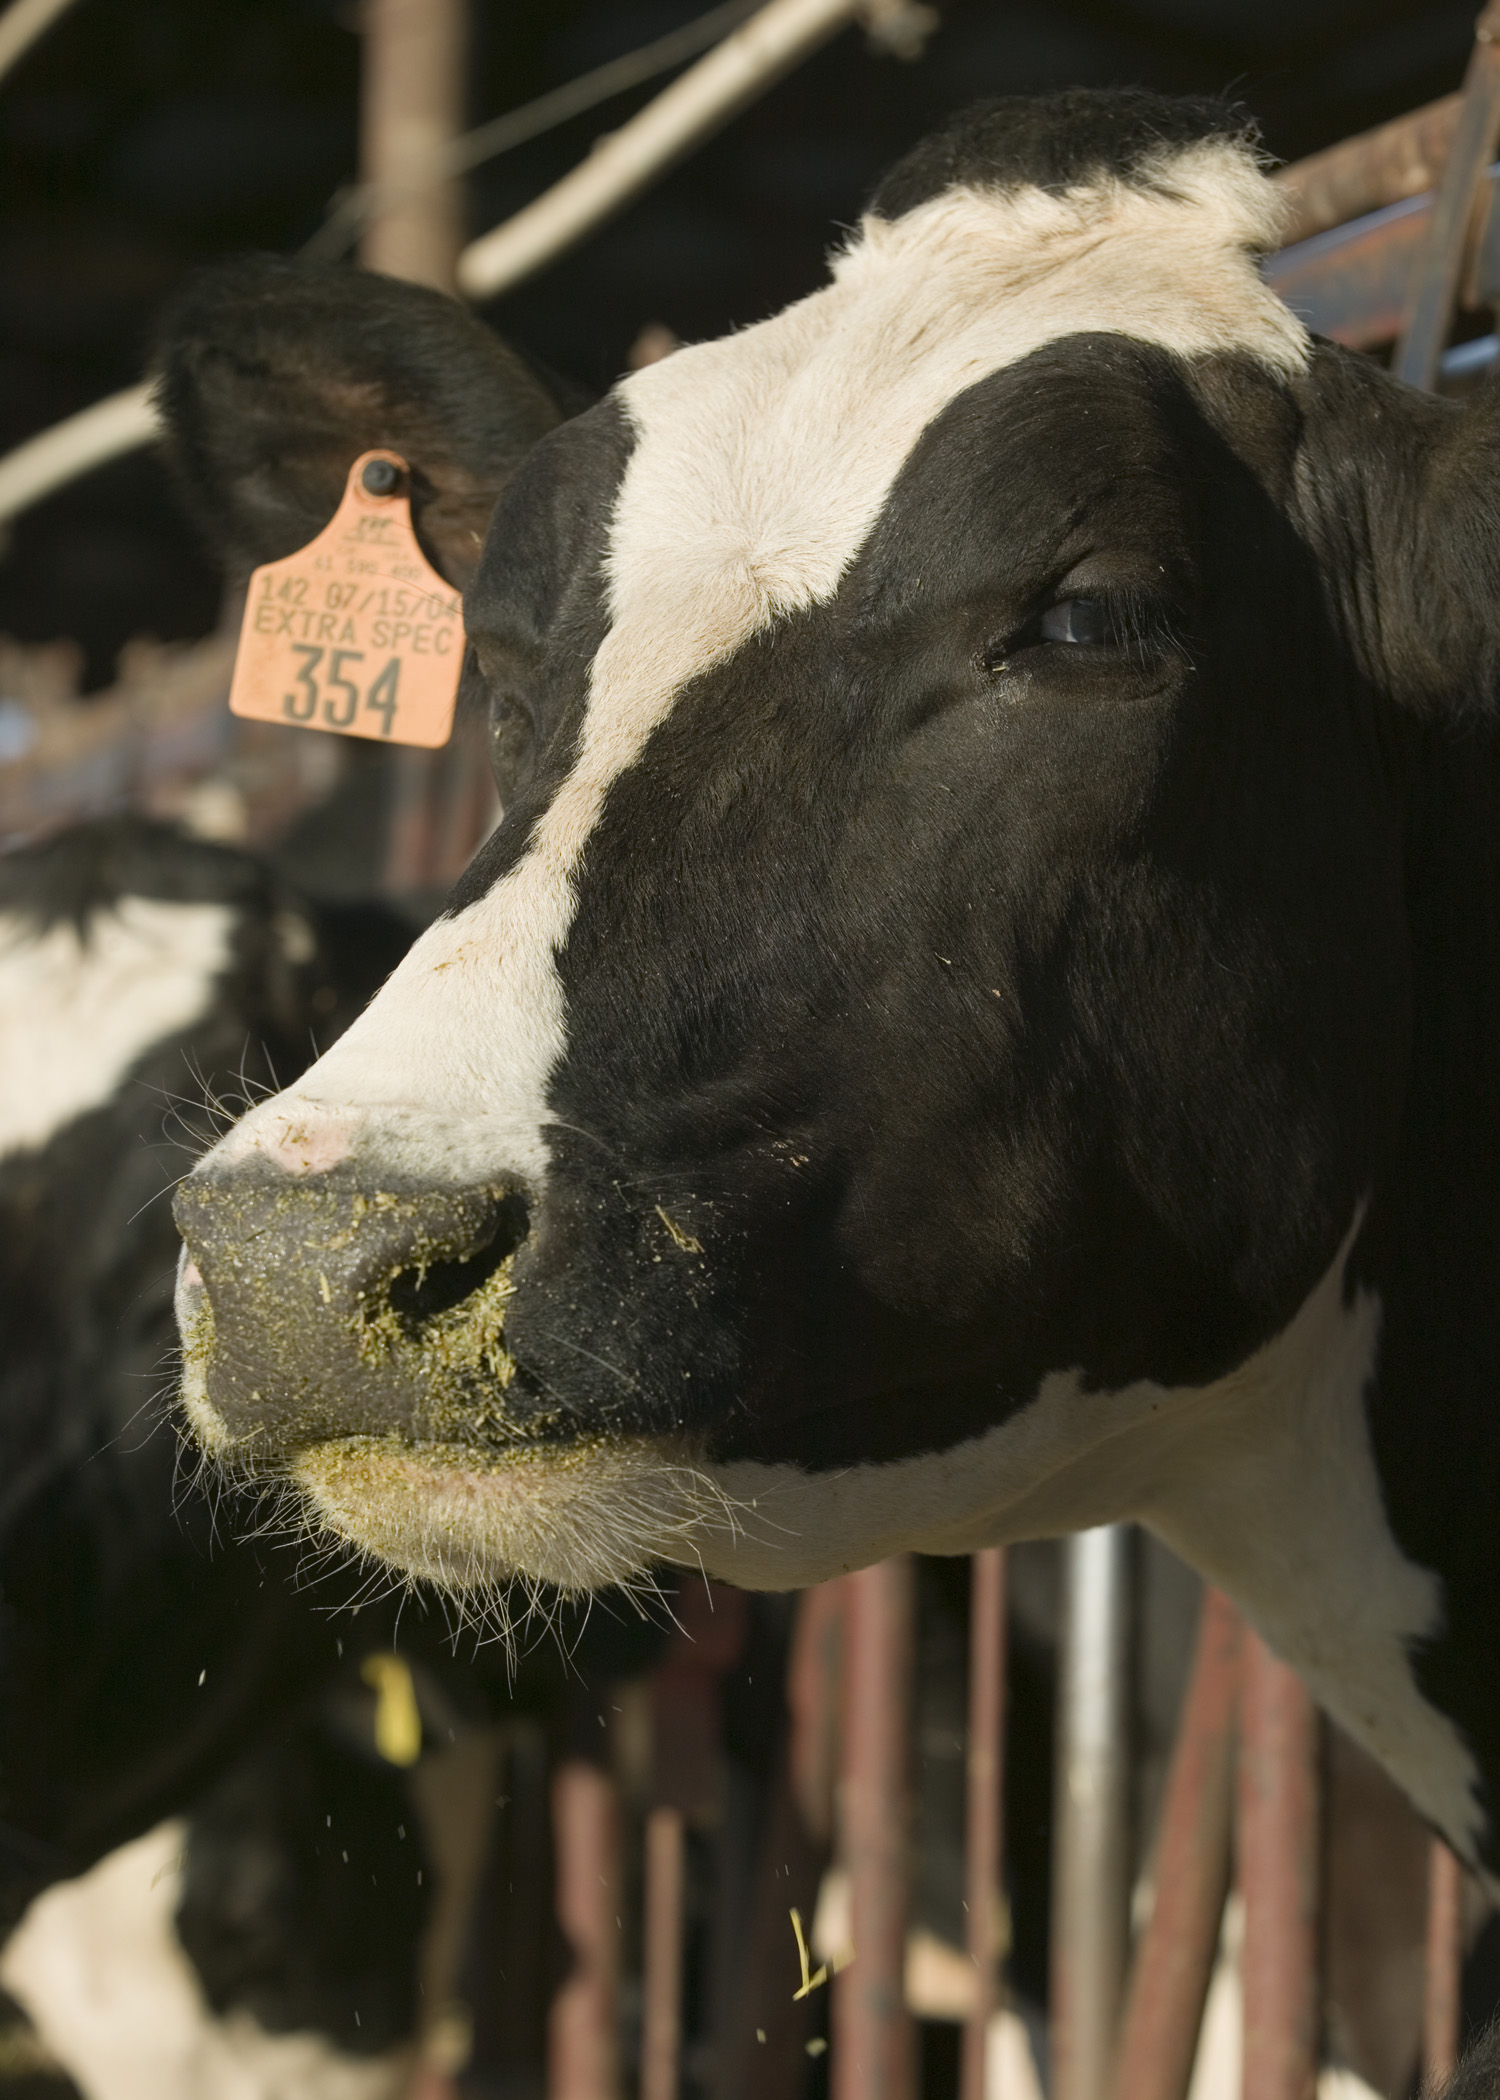
Figure 6—Origin of the Holstein breed
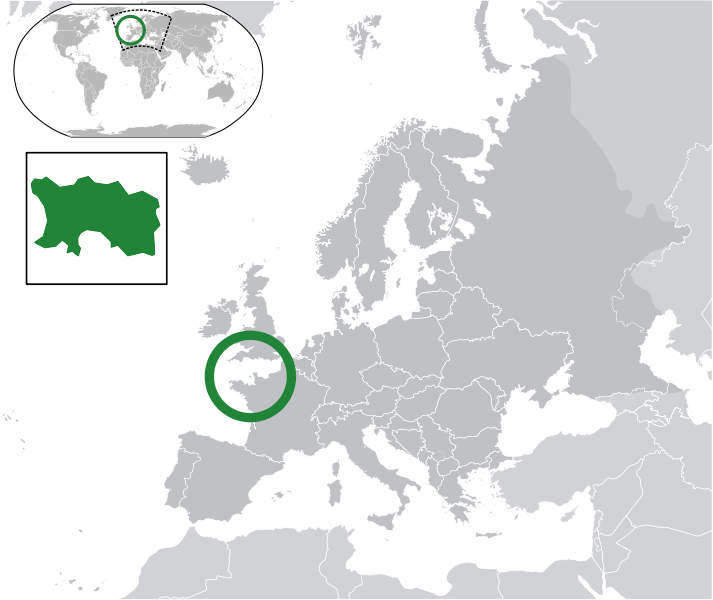
The smaller brown cows are Jersey cattle, which originated from the Isle of Jersey in the English Channel. Although a single Jersey produces less milk than a Holstein, Jerseys convert feed to milk more efficiently (Holsteins therefore produce more because they eat more). The OSU dairy farm had only a few Jerseys until the price of corn rose to historical levels, at which point they integrated more Jerseys for their more efficient conversion of feed to milk. Milk from Jersey cows is also higher in butterfat, and if butterfat is scarce relative to fluid milk, the output of Jersey cows can elicit a higher price than their Holstein counterparts. For these reasons, Jerseys can be more or less profitable than Holsteins, depending on the price of feed and consumer demand for milk, cheese, and butter. (G1)
Figure 7—Jersey breed
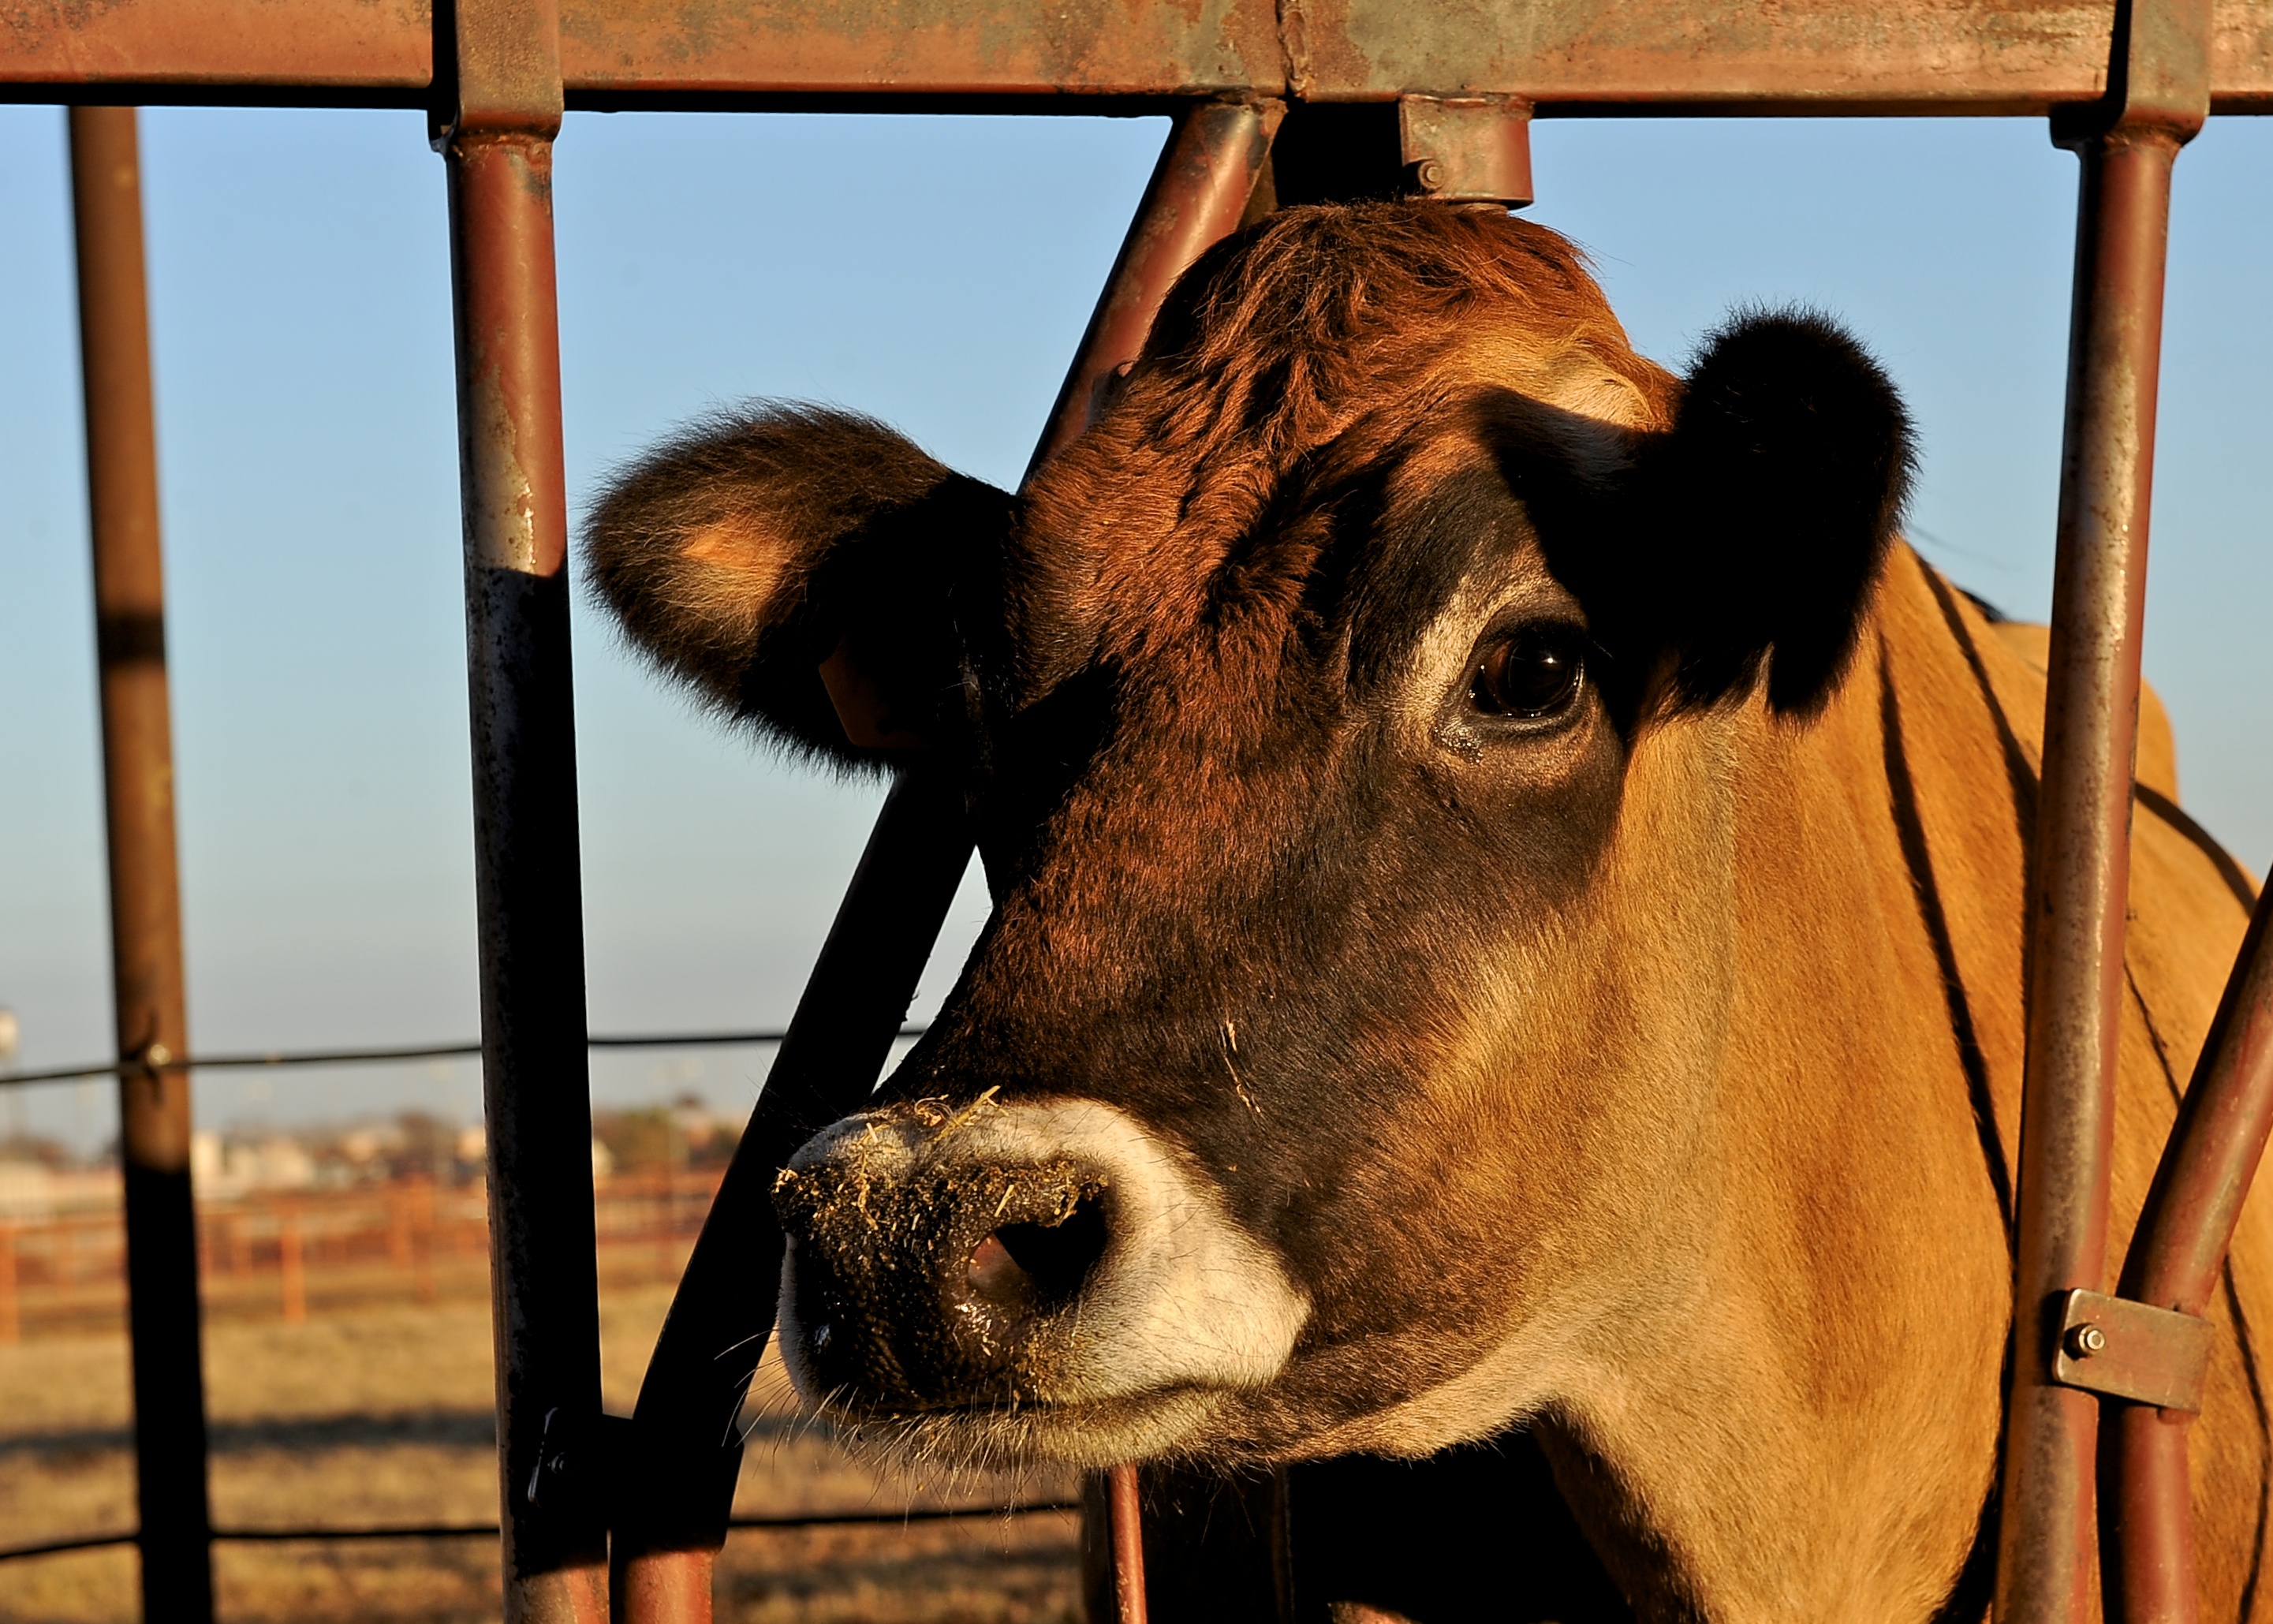
Figure 8—Origin of Jersey breed
Interestingly, while the Jersey cows are gentle and have a gregarious personality, the meanest animal I have ever seen in my life was a Jersey bull. I hear Holstein bulls are no better.
Although improvements in breeding were made after the time of Henry VIII, identifying the best bulls didn’t receive as much attention as it does today. This might be because they had ineffective means for collecting data and so no good system for designating which bulls were truly superior. The quality signals they relied on were flawed. When a farmer in the Elizabethan Age set about trying to determine whether a cow would produce a lot of milk they might look at the direction of its hairs on the rear part of her udder, a custom which had about as much validity as the many superstitions that existed at the time.(F1)
Today, milk production is a highly advanced science, and an enormous data collection program has been established, allowing dairy producers to use statistics—not myths or tradition—to identify the best genetics.
So if the carbon footprint of your milk is a major concern for you, then nothing is more important than the semen the farmer buys to impregnate her cows. The good news is you don’t need to worry about whether the farmer is reducing the carbon footprint of milk. The farmer has even more incentive than you to produce more milk with fewer inputs, and so this increase in productivity and reduction in carbon footprint over the last century came about by farmers doing what they do best: increasing the productivity of their animals. It came about out of the farmers’ self-interested pursuit of profits, not concern for the environment, as global warming did not exist as an issue in 1945.
The same thing goes for better nutrition, the second most important reason for higher dairy productivity. Before the 16th century a lot of farmers would slaughter much of their livestock in the fall because they couldn’t produce enough feed to carry them through the winter. This first changed once they learned to grow turnips for a winter feed. Over the next few centuries small advancements in nutrition were made, but still, even in 1900, the science of nutrition was hardly a science at all.(A1,M1)
The twentieth century ushered in new ways of processing feed to provide more nutrition. Corn was now cracked, ground, or made into flakes (surprisingly similar to Kellogg’s corn flakes in both appearance and taste), which allowed the cow to digest more of the corn. Dairies used to formulate feed rations based on the protein needs of the cow, but they learned that making rations based on the cow’s energy needs instead improved cattle health and farm productivity. As new varieties of grain increased yields the price of grain fell, making it cheaper to feed cattle highly nutritious grain. Better machines for raising grains lowered feed prices even more. All of this gave the dairy industry more options in what to feed, and more options translated into more nutritious feed.
Figure 9—Origin of Cheetos

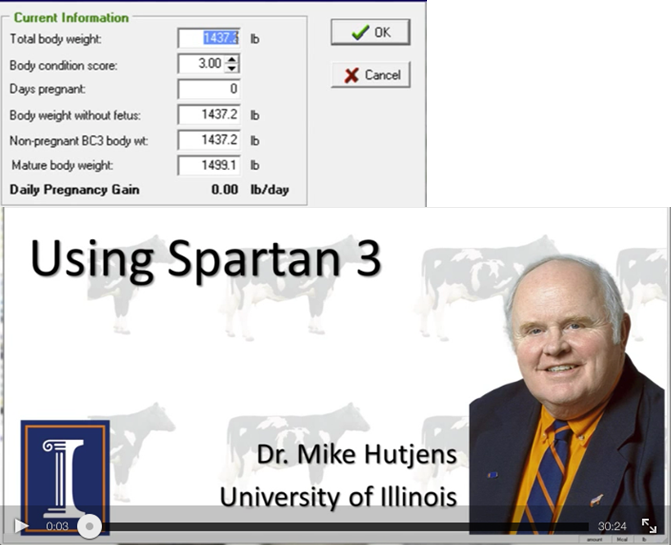
Today, more thought is given into what these cows eat than what we feed our pets—or even ourselves. Computer programs are used to determine exactly what cows will be fed, and this program is used to deliver the precise nutrition needs at each stage in its life, and at the least cost the farmer. Farmers may hire consultants to help formulate feed rations, or may use some of the free programs provided by university scientists (like the Spartan 3 program by Dr. Hutjens at the University of Illinois). Whatever strategy is taken, the feed will be determined based on the size of the cow, whether the cow is lactating, an enormous amount of data on nutrition requirements and milk prices, and a computer optimization routine to make sense of it all. This is why students in agricultural economics and animal science learn mathematical optimization algorithms in college. Since roughly half of the dairy farm’s cost is feed,(D1) and since small deficiencies in nutrition can cause considerable shortfalls in milk production, a farmer can thrive or go bankrupt based on her feeding strategy.
Figure 10—Computer program to formulate dairy cattle feed
(Accessed January 6, 2013 at http://www.youtube.com/watch?v=37bHvCG92zc)
Some of the more controversial technologies like synthetic growth hormones can increase productivity but their importance is probably overrated by the general public. Giving cows injections of rBST, a synthetic growth hormone, raises milk production by 5 to 15%, but due to consumer concerns is rarely used. Moreover, it wasn’t used until the 1990s, and as Figure 1 shows, the trend in productivity began much earlier. So the major factors behind milk’s falling price are better genetics and better nutrition, and so those are the major factors behind milk’s falling carbon footprint as well.
Feed supplements for a smaller footprint?
There are other ways of reducing milk's carbon footprint than just producing more efficiently. A major problem dairy is that cows belch methane, a greenhouse gas. Cows have four different stomachs, and the largest one is called the rumen. (Note: some people say a cow has ONE stomach with four different COMPARTMENTS. That's not the semantics I'm using. On the quiz use the semantics: four stomachs.) This is the stomach Dr. Norwood reached his hand into in the video with the fistulated cow. The bacteria in the rumen help breakdown the cattle feed, and as a by–product of this process, methane gas is created. The animal cannot use this gas, so it expels it through belching.
For this methane to be produced a specific enzyme in the stomach is needed, and scientists have discovered a number of chemicals that can block this enzyme, preventing methane from being made. Garlic, for instance, contains such chemicals, as does seaweed. If we add these enzyme inhibitors to cattle feed then we might be able to reduce the carbon footprint of milk.
Scientists have recently discovered one particular methane inhibitor with great promise. Named 3-nitrooxypropanol, or 3NOP, it was found to reduce methane emissions from dairy cows by up to 30% when added to dairy feed (note: the total carbon footprint reduction would be less than 30% because methane emission through belching is just one of a number of greenhouse gas sources associated with dairy production). Even better, cows receiving the feed gained more weight and produced more milk, as energy previously loss due to the formation of methane is now available to the cow. There are other inhibitors that work even better, but 3NOP seems particularly promising because it also appears safe for both the cows and the humans who drink their milk, whereas the safety of other inhibitors is more dubious.(P2)
Whether 3NOP should be used in milk production depends also on the carbon footprint required to make the 3NOP in the first place, as well as the cost of making 3NOP. It might be that it is relatively inexpensive to make and will allow us to consume milk with less damage to the environment. Or, if 3NOP is expensive, some climate–conscious consumers might choose soy milk instead, whose carbon footprint is probably much smaller.
Unless 3NOP is cheap and boosts milk production considerably, farmers would need an incentive before they would be willing to add it to feed. This is why some people believe that the price of milk should include the environmental damages caused by its carbon footprint. There are a number of ways to accomplish this.
- Tax farmers based on the carbon footprint of milk. Earlier we showed that milk creates about 723 grams of CO2–e per pint of milk. They could then be taxed an amount equal to (pints of milk produced per cow)(number of cows)(723)(designated tax rate). If researchers believe the use of the supplement lowers this footprint to 500 grams, the total tax paid by a farmer using the supplement would then be (pints of milk produced per cow)(number of cows)(500)(designated tax rate). Because they would save money on taxes, so long as the price of the supplement isn't too high, they would use it.
- One could subsidize the use of the supplement, perhaps even provide it for free. Given that the supplement does increase milk production, so long as the government makes it cheap enough through subsidies that the price of the supplement is less than the increase in revenues from more milk, farmers will use it.
- Of course, one could always just pass a regulation requiring farmers to use the supplement.
- If consumers really care about the carbon footprint of their food, they might be willing to pay higher prices for milk produced using the supplement. Farmers using the supplement might then be able to brand their product as more climate–friendly and charge a higher price to offset the cost of the supplement, just as cage–free egg producers charge higher prices for their eggs. It might be that the government is needed to verify who is truly using the supplement or not, just as the government certifies organic farmers.
Figures
(1) Original figure created from data accessed on July 8, 2014 at http://www.infoplease.com/ipa/A0873707.html and a price deflator at http://www.reffonomics.com/TRB/chapter20/inflationcalculator.html.
(2 and 3) Original figure. Sources: F1, D1, C1.
(3) Royalty free image from freeimages.com with modifications by the author.
(5) Photo from DASNR Kitchen Sink
(7) Maps taken from Wikimedia Commons (source is in the picture)
(7) Photo from DASNR Kitchen Sink
(8) Maps taken from Wikimedia Commons
(9) Screenshot from YouTube.com
References
(A1) Albala, Ken. Food: A Cultural Culinary History [lectures]. The Great Courses. The Teaching Company.
(A2) American Cancer Society. Learn About Cancer: Recombinant Bovine Growth Hormone [webpage]. Accessed May 20, 2014 at http://www.cancer.org/cancer/cancercauses/othercarcinogens/athome/recombinant-bovine-growth-hormone.
(C1) Capper, J. L., R. A. Cady, and D. E. Bauman. 2009. “The environmental impact of dairy production: 1944 compared with 2007.” Journal of Animal Science. 87:2160-2167. DOI: 10.2527/jas.2009-1781.
(D1) Damron W. Stephen. 2006. Introduction to Animal Science. Third Edition. Pearson Prentice Hall: NY, NY.
(D2) David, A. Jones, manager of dairy farm at Oklahoma State University. 2014. Personal communication.
(E1) United States Environmental Protection Agency. Ag 101: Dairy Production [web article]. Accessed February 13, 2014 at http://www.epa.gov/oecaagct/ag101/printdairy.html
(E2) Ebner, Paul. February 24, 2010. Basics of antibiotics and hormones in animal production [video]. Purdue University. Accessed July 10, 2013 at http://www.youtube.com/watch?v=LIlAVnQIluI.
(F1) Fussell, G. E. 1966. The English Dairy Farmer 1500-1900. Frank Cass & CO.
(F3) Data acquired from OSU dairy farm. 2014. These were the data used to determine what a dairy cow consumes in 2014. Reference C1 was then used to infer what a dairy cow consumed in 1945.
(G1) Gillepsie, James R. 2004. Modern Livestock & Poultry Production. Seventh Edition. Thompson Delmar L
(G2) GLH, Incorporated. February 13, 2014. National Milk Drug Residue Data Base Fiscal Year 2013 Annual Report. Accessed May 20, 2014 at http://www.kandc-sbcc.com/nmdrd/fy-13.pdf.
(J1) Juskevich, J.C. and D. G. Guyer. August 24, 1990. “Bovine growth hormone: human food safety evaluation.” Science. 249(4971):875-84.
(I1) Illinois Farm Burea. Not dated. Facts About Antibiotic Use [web article]. Illinois Farm Bureau. Accessed March 19, 2014 at http://www.ilfb.org/media/196357/final_antibiotics.pdf.
(K1) Kanter, Christopher, Kent D. Messer, and Harry M. Kaiser. 2009. “Does Production Labeling Stigmatize Conventional Milk?” American Journal of Agricultural Economics. 91(4):1097-1109. DOI: 10.1111/j.1467-8276.2009.01317.x.
(L1) Lusk, Jayson L. 2008. Experimental Auctions: Methods and Applications in Economic and Marketing Research. Cambridge University Press: NY, NY.
(M1) Mazoyer, Marcel and Laurence Roudart. 2006. A History of Agriculture: from the Neolithic age to the current crisis. Monthly Review Press: NY, NY.
(M2) Muirhead, Sarah. June 9, 2008. “Tyson told to withdraw label.” Feedstuffs. Page 5.
(M3) Moulton, Libby. October 28, 2010. “Labeling Milk from Cows Not Treated with rBST: Legal in all 50 States as of September 29th, 2010.” The Columbia Science and Technology Law Review. Accessed July 11, 2013 at http://www.stlr.org/2010/10/labeling-milk-from-cows-not-treated-with-rbst-legal-in-all-50-states-as-of-september-29th-2010/.
(N1) Norwood, F. Bailey and Jayson L. Lusk. 2011. Compassion, by the Pound. Oxford Publishing: NY, NY.
(N2) National Agricultural Statistics Service. Quick Stats [database]. United States Department of Agriculture. Accessed February 13, 2014.
(N3) Norwood, F. Bailey, Michelle Calvo, Sarah Lancaster, and Oltenacu Pascal. 2014. Agricultural and Food Controversies: What Everyone Needs to Know. Oxford Publishing: NY, NY.
(P1) Prickett, Rob, F. Bailey Norwood, and Jayson L. Lusk. 2010. “Consumer Preferences for Farm Animal Welfare: Results From a Telephone Survey of U.S. Households.” Animal Welfare. 19:335-347. (This figure is taken from a draft of the published paper.)
(R3) Ruegg, Pamela L. Treatment of Clinical Mastitis [web article]. University of Wisconsin-Madison. Accessed March 20, 2014 at http://milkquality.wisc.edu/wp-content/uploads/2011/09/treatment_of_clinical_mastitis.pdf.
(Y1) Yu, Herbert and Thomas Rubin. September 20, 2000. “Role of the Insulin-Like Growth Factor Family in Cancer Development and Progression.” Journal of the National Cancer Institute. 92(18).